
 Français
  Deutsch
  Español
  Italiano
  Nederlands
  Português
  Brasileiro
  Ελληνικά
  Polski
  Română
  Svenska
  Türkçe
  Български
  हिंदी
हिंदी 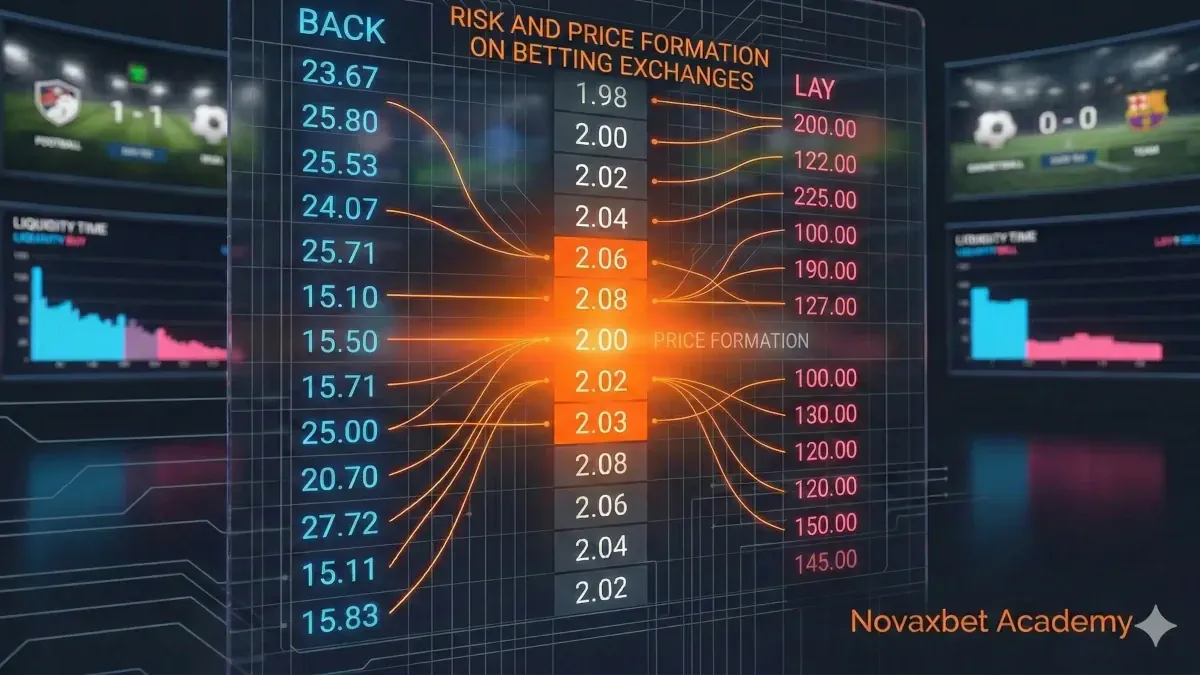
Risk and Price Formation on Betting Exchanges
Explains how prices emerge on exchanges and how risk is distributed between market participants.
Novaxbet Editorial •2026-03-01•6 min read
On a traditional bookmaker platform, prices are created centrally and adjusted by the operator to manage exposure. On a betting exchange, prices emerge organically from interaction between participants.
There is no predefined “correct” odd and no house deciding probability. Every available price exists because one participant is willing to accept risk while another participant is willing to take the opposite exposure.
Price is therefore not imposed — it is negotiated.
A betting exchange operates less like a sportsbook and more like a decentralized marketplace where probability continuously adjusts according to capital flow.
The Core Mechanism: Supply and Demand
Exchange markets function through opposing expectations.
Backers create demand by betting on an outcome they believe is undervalued.
Layers create supply by offering odds against that outcome, accepting liability because they believe the probability is overstated.
When demand exceeds supply at a given price, odds shorten.
When supply exceeds demand, odds drift higher.
Example
Imagine a football team trading at odds of 2.00.
- Multiple participants begin backing the team heavily.
- Available lay offers at 2.00 are fully matched.
- Remaining backers must accept lower prices such as 1.98 or 1.96.
The price moves downward not because certainty increased, but because opposing liquidity disappeared at that level.
Markets move toward balance — not truth.
From Odds to Probability
Exchange odds translate directly into implied probability:
Implied Probability = 1 / Odds
Example
| Odds | Implied Probability |
|---|---|
| 2.00 | 50% |
| 1.80 | 55.56% |
| 1.50 | 66.67% |
If price moves from 2.00 to 1.80, the market signals that participants collectively now assign a higher likelihood to the outcome.
However, this probability is capital-weighted, not democratic.
If one trader risks €50,000 at 1.80 while many smaller users back modest stakes at 2.00, equilibrium will still move toward 1.80 because markets respond to exposure size rather than participant count.
Money expresses conviction.
Order Flow: The Hidden Driver of Price
Price movement depends not only on how much money enters the market but how orders interact with liquidity.
Two behaviors dominate exchange markets:
Aggressive Orders
Orders that immediately accept available prices.
Example:
- A trader instantly backs at the best lay price.
- Existing liquidity is consumed.
- Price shifts to the next available level.
Passive Orders
Orders placed in the book waiting to be matched.
Example:
- A layer posts liability at higher odds.
- Liquidity increases.
- Price stability improves.
Aggressive flow moves markets.
Passive flow stabilizes them.
Markets respond to interaction, not participation alone.
Liquidity Imbalance and Market Behavior
Liquidity represents the amount of capital available to absorb trades without large price changes.
High Liquidity Example
Major football match shortly before kickoff:
- Large volumes available across price levels.
- Significant bets execute without major movement.
- Spread remains tight (for example 1.95 / 1.96).
Result: Stable pricing.
Low Liquidity Example
Minor league match opened days in advance:
- Limited money available.
- A €1,000 order removes several price levels.
- Odds jump from 2.10 directly to 2.30.
Result: Fragile equilibrium.
Low liquidity increases sensitivity.
Price becomes reactive rather than stable.
Volatility as a Function of Liquidity
Volatility describes how easily price changes.
Exchange markets typically evolve through three structural phases:
Formation Phase
Early market opening.
- Low liquidity
- Wide spreads
- Rapid adjustments
Compression Phase
Participation increases.
- Depth improves
- Price oscillations narrow
Convergence Phase
Event approaches.
- Information certainty rises
- Consensus probability forms
Example:
A tennis match may open at 1.70 two days before play, fluctuate between 1.60–1.85 as opinions differ, and stabilize near 1.65 shortly before start once lineup and conditions are confirmed.
Time itself improves efficiency.
Risk Transfer Between Participants
Every matched bet transfers exposure directly between users.
Example:
- Backer stakes €100 at odds 3.00.
- Layer accepts liability of €200.
- If outcome wins → layer pays €200.
- If outcome loses → backer loses €100.
The exchange carries no directional risk.
Unlike bookmakers, exchanges do not adjust prices defensively to protect themselves from results. Risk exists entirely between participants, allowing prices to approach fair value when liquidity is strong.
Risk is redistributed, not absorbed.
Spread, Cost, and Execution Reality
The spread is the difference between the best back and lay price.
Example:
- Best Back: 2.02
- Best Lay: 2.08
Spread = 0.06
A wide spread increases execution cost because participants must accept worse pricing to enter or exit positions.
Even without higher commission, poor liquidity indirectly raises trading expense.
Hidden cost often emerges from market structure rather than fees.
Informational Movement vs Structural Movement
Not all price movement reflects real probability change.
Informational Movement Example
A starting player is ruled out minutes before kickoff.
- Aggressive laying appears.
- Sustained volume follows.
- Price moves from 2.10 to 2.40 and remains stable.
Probability genuinely changed.
Structural Movement Example
Large liquidity provider cancels orders.
- Depth disappears.
- Price jumps briefly to 2.40.
- Liquidity returns and price falls back to 2.15.
No new information existed — only temporary imbalance.
Recognizing this distinction is essential for advanced interpretation.
Market Efficiency and Information Flow
Exchange markets become more efficient as:
- liquidity increases,
- participation expands,
- uncertainty decreases,
- arbitrage aligns prices across platforms.
However, inefficiencies persist due to emotional betting, reaction delays, capital limitations, and execution latency.
Markets trend toward efficiency but never achieve perfection.
Equilibrium, Fragility and Price Adjustment
Exchange prices represent temporary equilibrium.
Stability requires balanced liquidity on both sides.
Warning signs of instability include:
- widening spreads,
- disappearing volume,
- aggressive one-sided matching,
- sudden multi-tick movements.
Many dramatic price swings occur because equilibrium becomes fragile rather than because new information arrives.
Liquidity withdrawal alone can relocate price.
Understanding Price Formation
Exchange pricing is the continuous negotiation between belief, capital, time, and risk tolerance.
Odds are not predictions in isolation.
They are snapshots of agreement inside a living market.
Instead of asking:
“Is this price good?”
A structurally informed participant asks:
“Why does this price exist right now?”
Understanding risk and price formation provides the foundation for all advanced exchange mechanics — including slippage, market efficiency, exposure management, and execution cost analysis.
Price formation is not simply one concept within betting exchanges.
It is the mechanism through which exchange markets function.